
INTERFACE
Understand UI Areas
The Race Catcher UI consists of several panels, three of which exist for each selected project. These three panels are synchronized in presenting a specific point of interest within Class Tree View, Model View, and Source Code View.
The following section provides you with a basic understanding of Race Catcher UI panels.
Class Tree, Class Model, and Source Views
The Class Tree View, Class Model View, and Source Code View are dynamically interconnected as represented below:
Class Views
Menu Bar
Smart Projects
Info Panel
Analysis Button
Thread Table
Deadlock Table
RC Views
Class Tree Icons
Model View Icons
Status Bar

That is, a selection within any of these three views will automatically generate a corresponding selection within the other two views.
Menu Bar
The menu bar is shown below as it is seen on the Race Catcher UI.

FILE MENU
File/Create Project Manually
Creates a new project. Shortcut <Ctrl>+N on MAC <Ctrl>+<Cmnd>+N
File/Add Classes to Project
Adds classes to a project. Shortcut <Ctrl>+B on MAC <Ctrl>+<Cmnd>+B
File/View/Remove Projects
Opens dialog to View / Remove project(s) Shortcut <Ctrl>+E on MAC <Ctrl>+<Cmnd>+E
File/Exit
Closes Race Catcher UI.
VIEW MENU
Font selection Shortcut <Cntrl>+P on MAC <Cntrl>+<Cmnd>+P
Profiler results
Profiler code models
The two options above are two different views to choose from for the projects, which were run with the option:
Run->RaceCatcher Agent Run Options set for [v] Profiling (see below)
RUN MENU
RaceCatcher Agent Run Options <Cntrl>+R or on MAC <Cntrl>+<Cmnd>+R that dialog is seen on the next screenshot.
RaceCatcher Agent Filters is seen on the second screenshot below and is further explained on the help link under "Menu -> Quick Start -> Controlling overhead - Test vs Production" ...... "Run-Race Catcher Agent Filters"


TOOLS MENU
(see the following screenshot)
Use the following two options after selecting the project to perform the action on.
Build Project Models Shortcut <B>
Stop Building Project Models Shortcut <Esc>
The following two menu options are self-explanatory:
Backup and Reset Local Knowledge Base Shortcut <Ctrl>+<Shift>+B
- will result in an empty Projects panel.
Restore Local Knowledge Base from Backup Shortcut <Ctrl>+Shift>+R
- will bring the SUM UI into a specific, previously backed-up state.

Smart Project
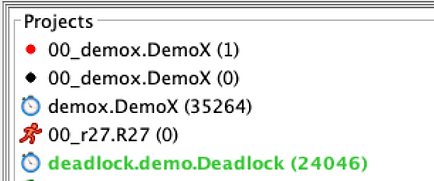
NOTE: The identification of each project you run in the SUM-Enabled Mode will be seen in as: package.MainClass (process ID).
Process Information Panel
Process Information panel contains the following information:
-
Process ID: As provided by an operating system.
-
Duration: Process duration.
-
Time Started: When the dynamic analysis for the process was started.
-
Time Ended: When the process ended.
A project with an active process will be highlighted in the Projects panel.
Analysis On - Off Button
Race Catcher Analysis can be switched from Analysis On to Analysis Off and back for any process running in Race Catcher Analysis mode. When SUM Enabled process is active, its name is displayed in the Project List View in a bright color.

Thread Contention Table
The information shown in the Thread Contention Table depends on the type of contention, as shown in the graphics below.
Race Contention Table

-
Class Name: Class that owns the method, which took a part in race condition or deadlock.
-
Method Name: Method that took a part in the race or deadlock.
-
Method Signature: Byte code notation is there to help distinguish between methods that have the same names within the same class.
-
Thread Name: Name of the thread involved in the race.
-
Shared Field: Location of memory that was the cause of contention.
-
Access Type: Each memory location involved in a race condition had specific access to it. That access was either for Read, for Write, or for both (Read/Write) (Note: Read/Write could be also shown as Write/Read, depending on the order of events in the Byte code).
Deadlock Contention Table

-
Class Name: Class, which owns the method that created thread(s) involved in the deadlock.
-
Method Name: Method that that created thread(s) involved in the deadlock.
-
Thread Name: Name of the thread involved in the deadlock.
-
Monitor Owned: The lock that the thread has obtained while waiting on the availability of another lock (Monitor Requested).
-
Monitor Requested: The lock requested by the deadlocked thread while holding the other (Monitor Owned) lock, being requested by some other deadlocked thread.
Race Catcher Views

Project List View
The Project List View (shown as "A") is the panel on the left.
NOTE: The full identification of each project you run in the SUM-Enabled Mode will be seen in the Project List View as: package.class (process ID).
Contention List View
The Contentions List View (shown as "B") is the panel under the Project List View.
Process Information Panel
The Process Information Panel View (shown as "D") is described above.
Race Contention Table or Deadlock Contention Table
The Panel E will have in it either "Race Contention Table" or "Deadlock Contention Table" described above.
Class Tree View
The Class Tree View (shown as "C") is the panel in the second row from the left.
For the full list of all possible icons and their descriptions, see Class Tree Icons below. The connection between the Source Code View, Class Tree View, and Class Model View has been explained above under Class Views.
Class Model View
The Class Model View (shown as "F") is the panel on the right.
The Class Model View is a graphical model of the class, including all the fields of the class and all the methods of the class, where methods are presented on the level of individual statements along with the control flow.
For the description of the icons used within a specific Class Model View, you can right-click on that Class Model View. The legends of all the icons used in that class will be explained.
For the full list of possible Model View icons and their descriptions, see Model View Icons below. The connection between the Source Code View, Class Tree View, and Class Model View has been explained above under Class Views.
Source Code View
The Source Code View (shown as "G") is the panel on the bottom.
NOTE: The different colors of highlighting in the Source Code View indicate the following:
Blue: The Shared Field had access "for Read".
Yellow The Shared Field had access "for Write" or "for Read/Write".
Class Tree Icons
The following Class Tree Icon list provides descriptions of the Class Tree View icons.

Model View Icons
The following Model View Icon list provides examples and descriptions of the icons.
